Business Context
A leading US retail pharmacy chain handles vast amounts of transactional, inventory, and customer data daily. This data comes from diverse sources, including APIs (REST and GraphQL), SQL/NoSQL databases, and third-party platforms such as marketing and logistics systems. The company requires a scalable ELT pipeline to ensure high-quality data is transformed and analyzed efficiently.
Problem Statement
The pharmacy faced the following challenges:
- Scattered Data Sources:
- APIs, SQL/NoSQL databases, and third-party platforms provided data in various formats and frequencies, making it difficult to consolidate.
- Data Quality Issues:
- Inconsistent customer details, duplicate entries, and missing product information created reporting inaccuracies.
- Performance Bottlenecks in Legacy ETL System:
- The traditional ETL process extracted and transformed data before loading it into the database.
- This approach could not handle 2 million new rows daily (~50 million rows in total).
- Inefficient Reporting:
- Tableau dashboards were slow, taking several minutes to load due to high query complexity.
Proposed Solution
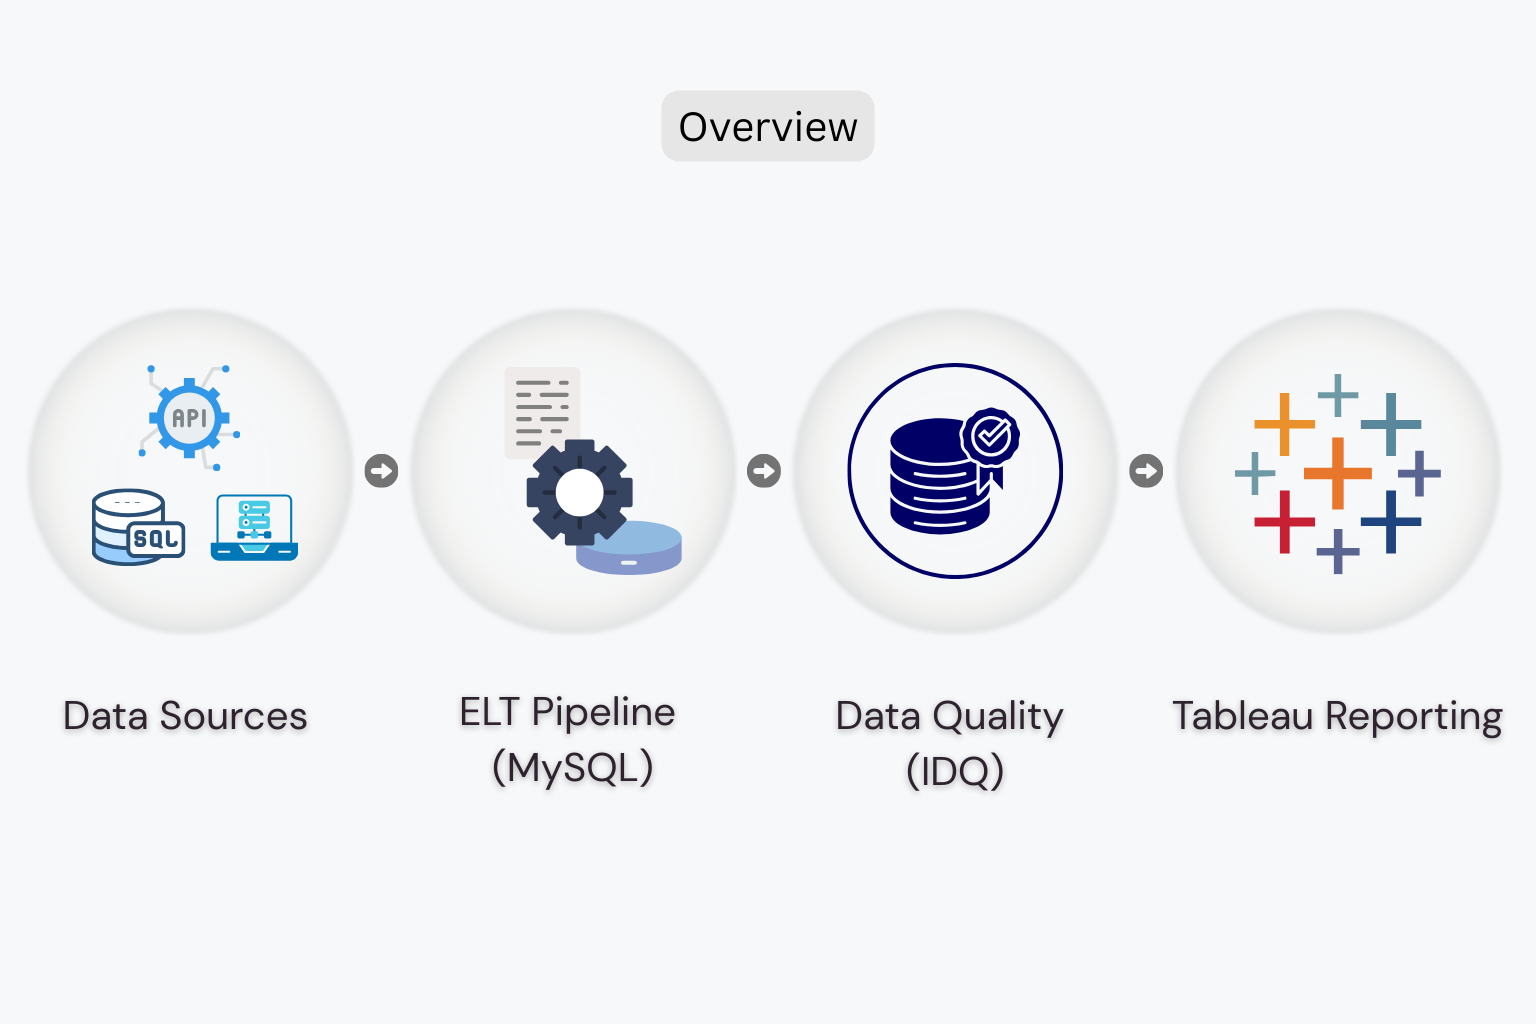
To address these challenges, the company implemented a modern ELT (Extract-Load-Transform) architecture with the following components:
- Data Sources:
APIs, SQL/NoSQL databases, and third-party platforms. - Data Quality Tool:
Informatica Data Quality (IDQ) for profiling, cleansing, and standardization. - Data Destination:
MySQL as the centralized data warehouse. - Reporting:
Tableau for analytics and visualization.
Scenario Details
Data Sources and Volumes
- APIs (REST, GraphQL):
- Customer transactions, loyalty programs, and prescription refills.
- Daily Volume: 1 million rows.
- SQL Databases:
- Inventory and store-level sales data.
- Daily Volume: 600,000 rows.
- NoSQL Databases:
- Real-time clickstream data from the pharmacy’s e-commerce platform.
- Daily Volume: 300,000 rows.
- Third-Party Platforms:
- Logistics, marketing campaigns, and supplier data.
- Daily Volume: 100,000 rows.
Solution Architecture
- Extract-Load (EL)
- Data is directly extracted from APIs, SQL/NoSQL databases, and third-party platforms in near real-time.
- Extracted data is loaded as-is into staging tables in MySQL without transformations.
- APIs are scheduled to fetch data every 15 minutes, while SQL/NoSQL databases use incremental loads.
- Transform (T): ELT in MySQL
- Transformations occur inside MySQL using SQL scripts, stored procedures, and views for better performance and scalability.
- Key Transformation Steps:
- Data Deduplication:
Identify and remove duplicate customer and transaction records. - Standardization:
Harmonize product names, customer addresses, and date formats. - Aggregations:
Summarize daily transactions, inventory levels, and campaign performance for Tableau. - Data Enrichment:
Join customer loyalty data with transaction history to derive customer lifetime value (CLV).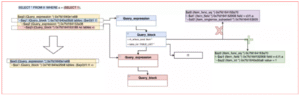
- Data Deduplication:
- Data Quality with Informatica Data Quality (IDQ):
- Profiling:
Regularly profile data to identify anomalies such as missing or invalid fields. - Cleansing:
Remove duplicates, validate email addresses, and ensure data consistency across sources. - Validation Rules:
Ensure business rules are met, e.g., product price > $0, valid prescription IDs.
- Profiling:
- Data Destination: MySQL as Centralized Repository
- Partitioning:
Data is partitioned by date to optimize query performance and storage. - Indexing:
Key fields like customer ID, transaction date, and product ID are indexed for faster lookups. - Compression:
Reduces storage costs while maintaining query speed for large tables.
- Partitioning:
- Reporting with Tableau
- Tableau connects directly to MySQL’s aggregated and transformed tables.
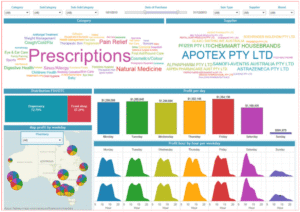
- Dashboards:
- Sales Dashboard:
Displays sales trends by store, region, and product category. - Inventory Dashboard:
Highlights stockouts and overstocked items by location. - Customer Insights Dashboard:
Provides metrics like CLV, loyalty program engagement, and top customers.
- Sales Dashboard:
- Optimizations:
Tableau’s extract mode is used for historical data, while live connections provide real-time updates.
Performance Metrics
- Data Volume Management:
- 2 million rows daily (~50 million total) are processed efficiently within the MySQL database.
- ELT ensures that raw data is loaded quickly, with transformations handled during off-peak hours.
- Improved Query Performance:
- MySQL’s indexing and partitioning reduce query execution times by 40%.
- Tableau dashboards load in under 5 seconds, down from several minutes previously.
- Data Quality:
- Informatica Data Quality ensures 99% data accuracy by resolving duplicates and fixing errors during profiling.
KPIs Monitored Post-Implementation
- Operational Efficiency:
ETL pipeline execution time reduced from 4 hours to 1.5 hours with ELT. - Reporting Speed:
Tableau dashboard loading time reduced from 3 minutes to under 5 seconds. - Sales Growth Analysis:
Enabled real-time insights into sales trends, increasing revenue by 8% through optimized promotions. - Inventory Optimization:
Reduced stockouts by 15% and overstock by 10% using near-real-time inventory monitoring. - Customer Engagement:
Enhanced loyalty program participation by 20% through data-driven campaign targeting.
Benefits of the ELT Approach
- Scalability:
MySQL can handle growing data volumes, ensuring scalability beyond the current 50 million records. - Efficiency:
ELT reduces the need for expensive compute resources during extraction and loading. - Improved Data Quality:
Informatica Data Quality ensures reliable data for decision-making. - Faster Reporting:
Tableau’s optimized dashboards empower executives with actionable insights, improving decision-making speed.
This ELT-based architecture transformed the pharmacy’s data operations, enabling efficient data processing, high-quality reporting, and data-driven decisions.