Website Redesign & Digital Platform Modernization for a Civic Engagement Organization
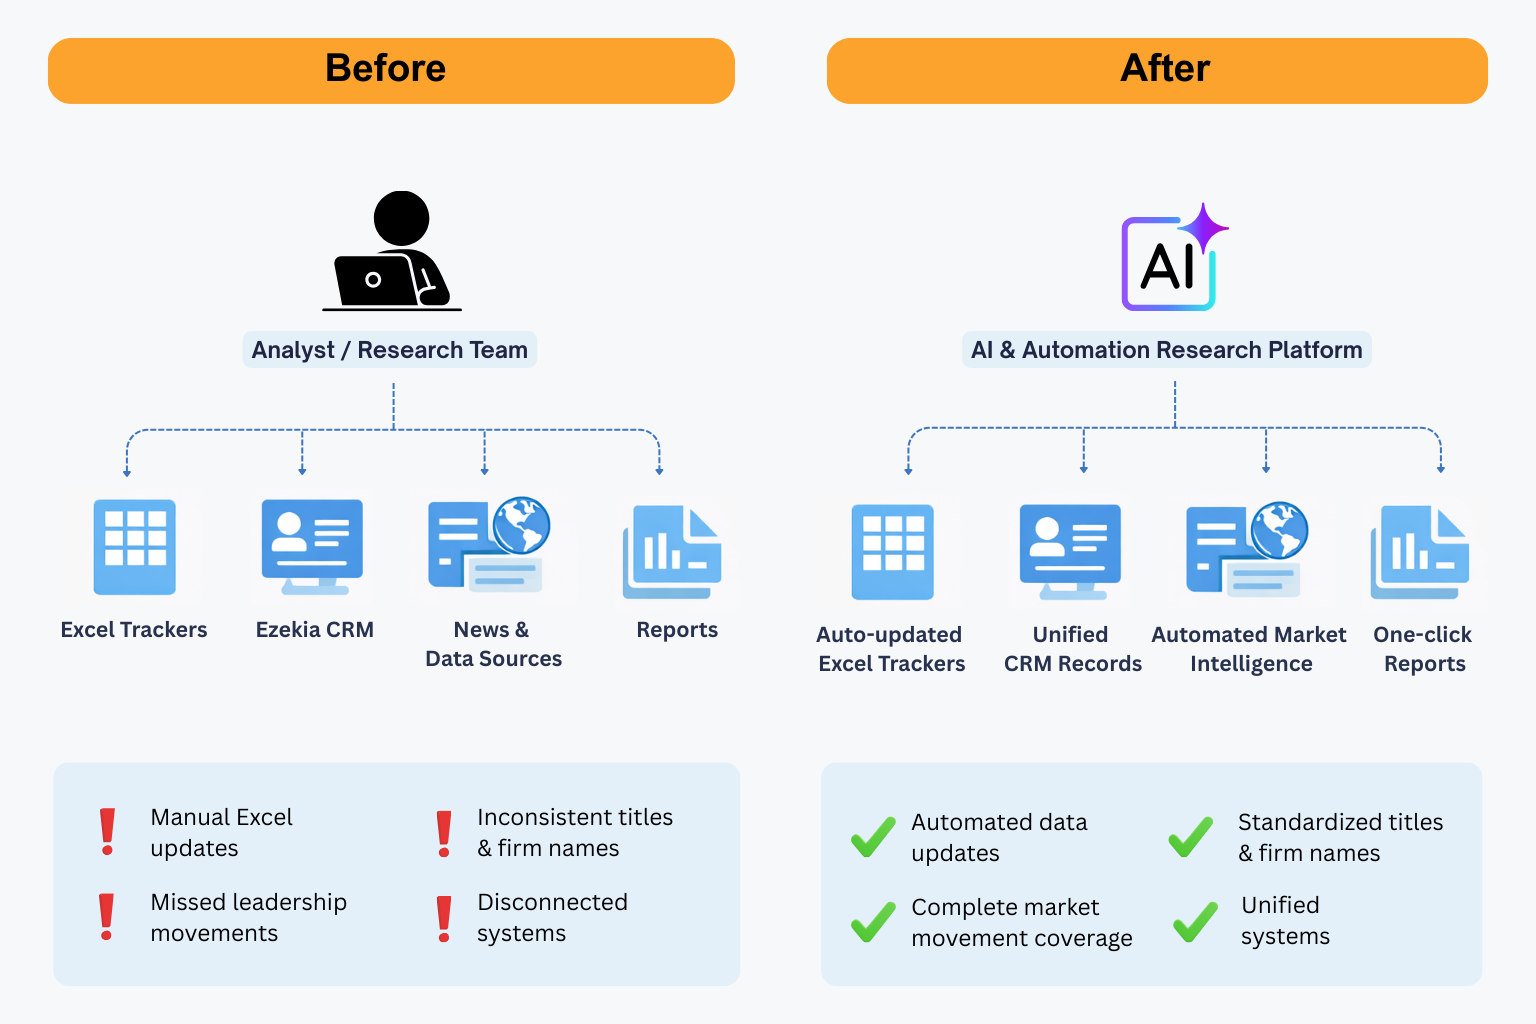
Background A civic engagement and democracy-focused organization with a 100+ year legacy plays a critical role in empowering voters, educators, students, donors, and policymakers. Its digital platform serves as the primary hub for election information, civic resources, events, and donations. However, the organization’s existing website, built on Apostrophe CMS, had become difficult to scale, hard …