

Problem Statement
A supermarket chain faced critical challenges that impeded their ability to make timely and informed business decisions:
- Slowness of Reports:
- Reports took hours to generate, delaying operational and strategic insights.
- High query complexity on large datasets led to performance bottlenecks.
- Fragmented Data Sources:
- Data was spread across multiple systems: SQL Server, Teradata, Salesforce, and CSV files.
- Manual consolidation resulted in inconsistencies and errors.
- Outdated Reporting Structure:
- Reports were poorly designed, lacking actionable insights and a unified structure.
- Key performance indicators (KPIs) were scattered across multiple, unrelated reports.
Proposed Solution
To address these challenges, the supermarket chain implemented a robust ETL pipeline using SQL Server Integration Services (SSIS), consolidated data into a SQL Server data warehouse, and restructured reporting with Power BI.
Scenario Details
Data Sources
- SQL Server:
- Stores transactional sales data from POS systems.
- Example Data: Transaction ID, store ID, product ID, quantity sold, sales amount.
- Daily Volume: 5 million rows.
- Teradata:
- Contains historical and aggregated sales data for trend analysis.
- Example Data: Monthly sales summaries, customer loyalty data, and product trends.
- Daily Volume: 3 million rows.
- Salesforce:
- Maintains customer data, including loyalty profiles and purchase history.
- Example Data: Customer ID, loyalty tier, lifetime value, and recent interactions.
- Daily Volume: 1 million rows.
- CSV Files:
- Regional campaign data and inventory restocking schedules provided by regional managers.
- Example Data: Campaign ID, region, forecasted sales, and restocking dates.
- Daily Volume: 1 million rows.
Solution Architecture
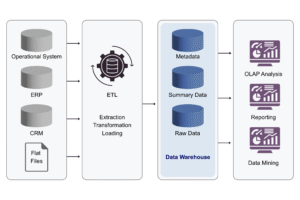
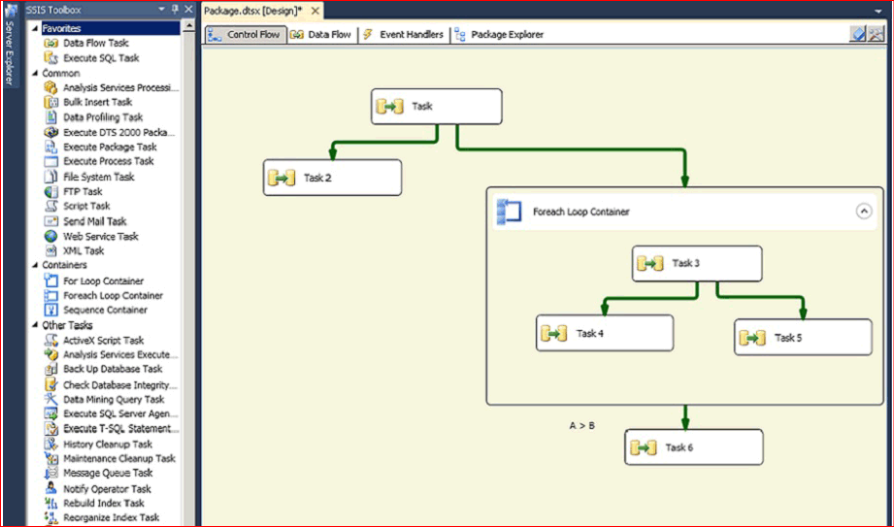
- ETL Tool: SQL Server Integration Services (SSIS)
| Stage | Details |
|---|---|
| Data Extraction |
|
| Data Transformation | Data Cleansing:
Standardization:
Enrichment:
Aggregation:
|
| Data Loading |
|
- Target Data Warehouse: SQL Server
- Schema Design:
- A star schema with fact tables for sales, inventory, and campaign performance.
- Dimension tables for products, customers, regions, and time.
- Performance Enhancements:
- Clustered indexing on transaction dates and product IDs.
- Compression and partitioning minimize storage overhead and improve query speed.
- Schema Design:
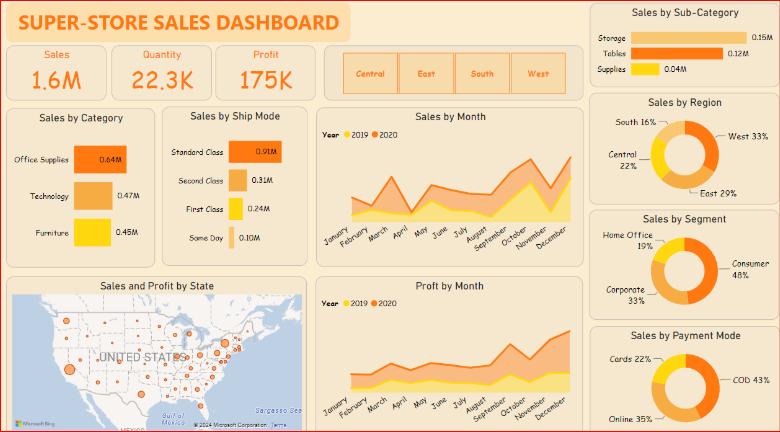
- Power BI for Reporting
- Restructured Dashboards:
- Unified dashboards for sales, inventory, and marketing campaigns.
- KPIs such as daily revenue, stock levels, and campaign ROI are visually highlighted.
- Optimizations:
- Power BI leverages SQL Server’s aggregated data for faster query execution.
- DirectQuery mode ensures real-time insights for frequently accessed data.
- Scheduled refresh every 6 hours ensures dashboards remain current.
- Restructured Dashboards:
Reporting Capabilities
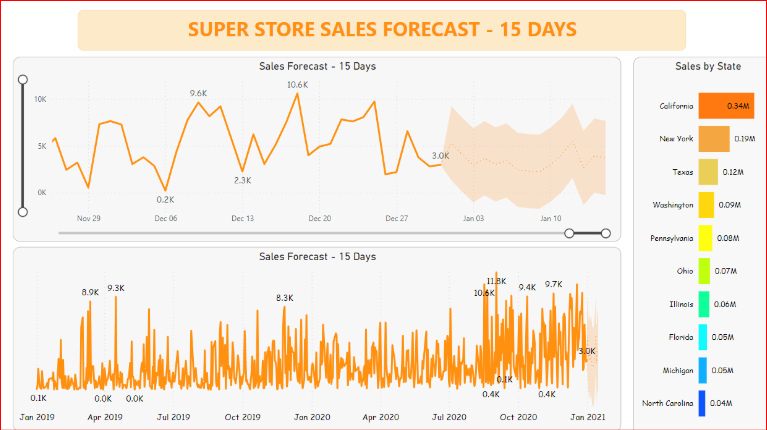
- Sales Performance Dashboard:
- Track daily and monthly revenue trends by store, region, and product category.
- Identify top-selling products and customer segments driving sales growth.
- Customer Insights Dashboard:
- Analyze customer loyalty tiers, purchase patterns, and lifetime value.
- Segment customers by region and preferences to tailor promotions.
- Inventory and Campaign Dashboard:
- Monitor stock availability and flag potential stockouts or overstocks.
- Evaluate the ROI and sales uplift from marketing campaigns.
Scalability and Performance Enhancements
- Data Volume Management:
- SQL Server handles 10 million daily rows with partitioning and indexing.
- SSIS pipelines are designed for parallel execution, reducing ETL runtime.
- Improved Reporting Speed:
- Pre-aggregated data in SQL Server minimizes query complexity in Power BI.
- Reports load within 3-5 seconds for 90% of queries, compared to hours before.
- Resilience:
- SSIS error-handling mechanisms include retries and logging for failed ETL jobs.
- SQL Server backups ensure data integrity and disaster recovery capabilities.
KPIs Monitored Post-Implementation
- Sales Performance:
Achieved 15% monthly revenue growth. - Customer Engagement:
Improved customer retention by 8% through loyalty analysis. - Inventory Efficiency:
Reduced stockouts to less than 1.5% of SKUs. - Campaign ROI:
Increased ROI to 5x by targeting high-value customer segments. - Report Performance:
Reduced report loading time to under 5 seconds for 90% of queries.
Outcomes and Benefits
- Streamlined ETL Process:
SSIS efficiently handles 10 million daily rows across SQL Server, Teradata, Salesforce, and CSV files. - Centralized Data Warehouse:
SQL Server consolidates data from disparate sources, ensuring consistency and accessibility. - Optimized Reports:
Power BI provides faster, actionable, and visually appealing insights. - Enhanced Decision-Making:
Unified reporting empowers teams to identify trends, optimize inventory, and improve customer engagement.
This solution resolved the supermarket chain’s data integration and reporting issues, delivering a scalable and high-performance analytics platform.